


The last drag event of the year for Harare was held last weekend and with the results posted we at Zimtorque thought it’d be a good time to cover some of the basics for those who attended the drags for the first time as a spectator or as a competitor looking to make improvements for next year . As i mentioned in my last article, drag racing may get brushed aside as the least skillful of motorsports but even its simplicity there is a lot to master. So without further ado, here’s our break down of the basics of drag racing.

First we’ll cover some of the basic terms and what information you can learn from your timeslips to help you go faster.
The Drag Strip:
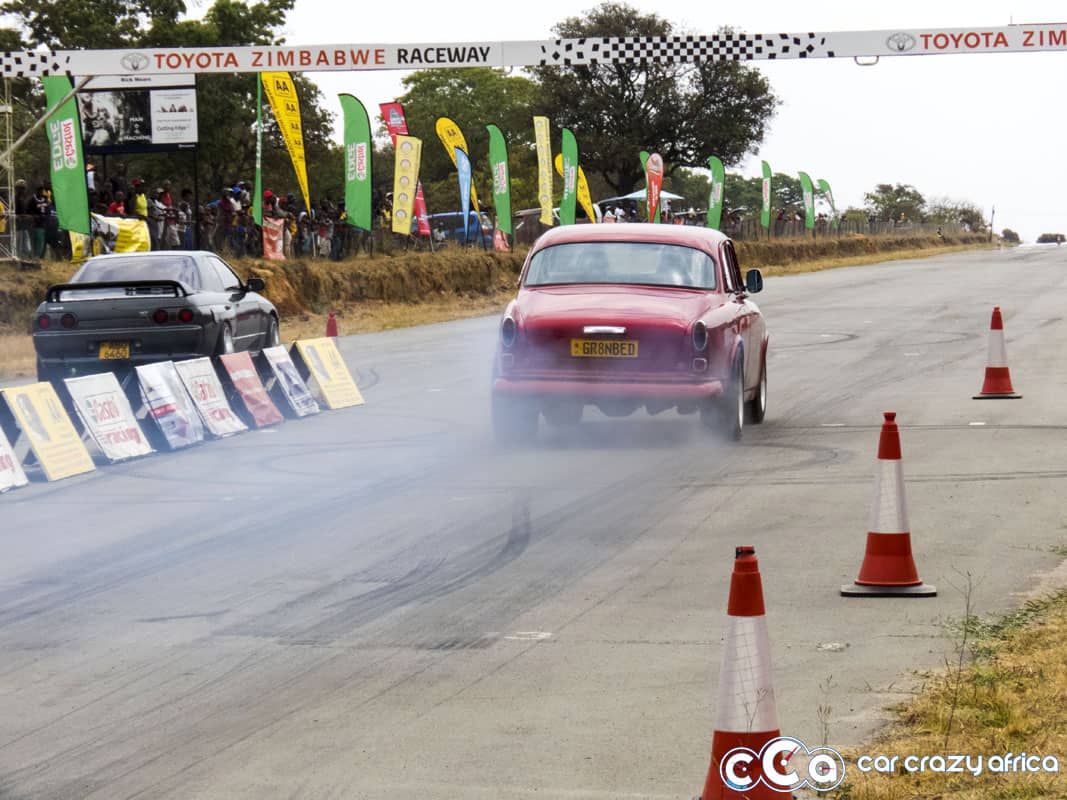
The straight where all the action happens. It’s 402 metres or 1320 feet. Donnybrook has a slight uphill gradient, and when compared to most tracks you may see on youtube, a more slippery surface than dedicated drag strips as it doubles as the main straight for circuit racing. This means our more powerful racers typically suffer from traction issues as the track isn’t as sticky.
The Christmas Tree:
The lights that start all the races. The top two white lights are the staging lights, followed by three amber lights and finally the green light (and a red for default below that). For qualification & grudge matches, the tree runs in Sportsman mode, where the amber lights glow in sequence to the green every 0.5 seconds. During nationals, all the ambers glow at once and then the green, so it requires a lot more concentration to get that perfect start.
The Timeslips
The timeslip is the little slip of paper that you get after each run. This slip breaks down each of the races and can be a treasure trove of information to help improve your racing.
- Reaction Time: This is the time between when the Christmas tree turns green and your vehicle moves out of the staging area. Basically how long if takes you to leave the line
- 60′ aka 60 foot: This is the time that the vehicle takes to travel the first 18.2metres.
- E.T aka Elapsed Time: This is the amount of time that the vehicle takes to cover the quarter mile. This tells you how fast a car accelerates. The elapsed time only starts once you leave the staging area. NOT when the Christmas tree turns green. So if it’s not an elimination or National race, you can take your time to get the perfect launch and chase your personal best time.
- Trap Speed: This is the speed captured by two sensors at the end of the quarter mile.
So what can we tell with this knowledge?
We can definitely see some trends happening by looking at each of the numbers on the timeslips or the results. By comparing your own or two cars timing slips or results you can learn where you need to improve to catch up or beat a rival.
- Reaction Time: This one is pretty simple and straighforward. The lower your reaction time the quicker your vehicle gets moving and when it comes to head to head races between two very evenly matched cars, this can decide the winner in a race
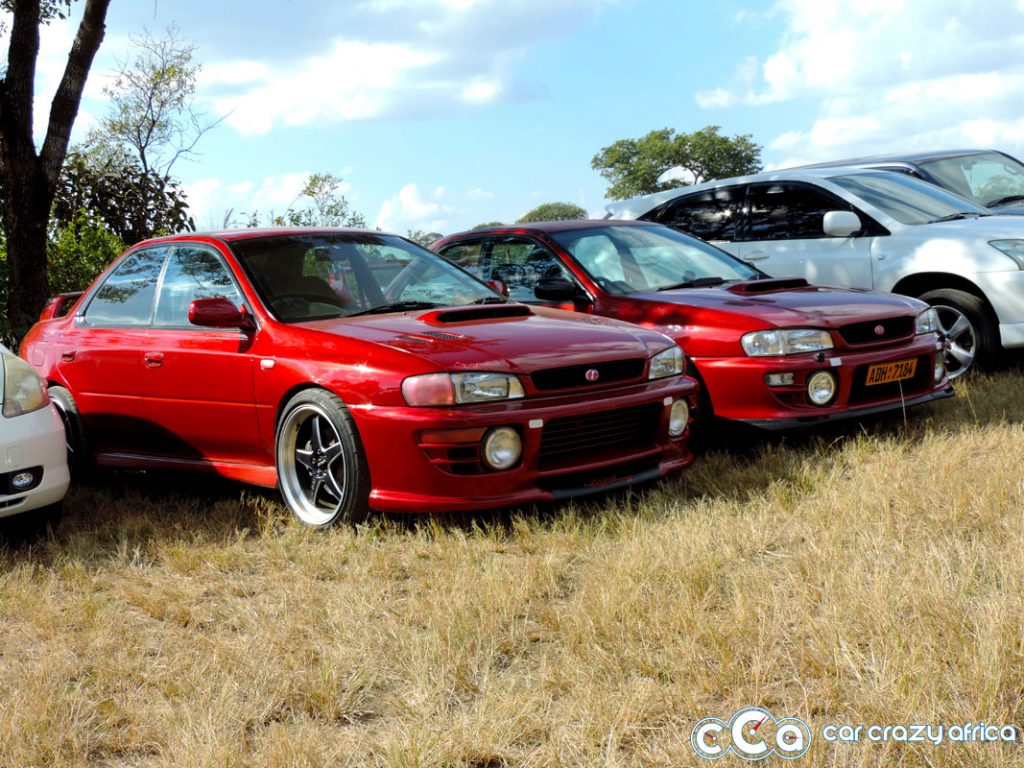
- 60 Foot (60′): This is great tool to judge how much traction your vehicle has.If you scroll down the results you will find generally All Wheel Drive(AWD) vehicles like Subaru’s tend to have the lowest 60′. With all four wheels putting the power down they get the best launch. So what do you do if you have a Rear Wheel Drive(RWD) or worse a Front Wheel Drive (FWD) vehicle that’s spinning the tires on launch? (FWD tend to suffer worse than RWD because the weight transfer moves to the rear, giving the front wheels even less traction). In the case of RWD vehicles you can add weight over the tires, but that only really works if you have enough power to overcome the weight handicap. Option 2, is lowering tire pressure a bit to increase the contact patch and give yourself a bit more grip. Option 3 is investing in some drag radials, these have much softer sidewalls than road tires and softer, stickier compounds to give you even more grip off the line. Providing you do get more traction, its generally accepted that every 0.1 seconds you lose in the 60′ you lose about twice as much in your final ET. Cars with great power to weight ratios or those with shorter gearing will tend to accelerate really quickly and achieve lower ET’s. But what about cars like the X6 and Jeep SRT8 that put down quick ET’s and weigh slightly less than a house? Well they are AWD and also tend to have lots of power and wide tires too to compensate.
- ET or Elapsed Time: This is the amount of time it takes you to cover the track. As you would have read above, how well you put down power in the 60′ will have an impact on your total elapsed times as well as a few other factors. Your ET is a good overall measure of how well the traction side and the power side of your build is coming together. Comparing your trap speed(explained below) and your 60′, you can see where a potential issue could be, poor shifting, bad traction, loss of power etc.
- Trap Speed: This is a good way to tell the power of a vehicle. The more powerful a vehicle, the higher its trap speed is likely to be. This is useful when comparing similar vehicles to work out which car is more likely to be more powerful, or to asses the gains/losses when installing power adders to your vehicle. So how does the trap speed tell you about the power of a vehicle? Let’s go back a little to high school physics class:
Specifically Power = Mass x Acceleration x Velocity.
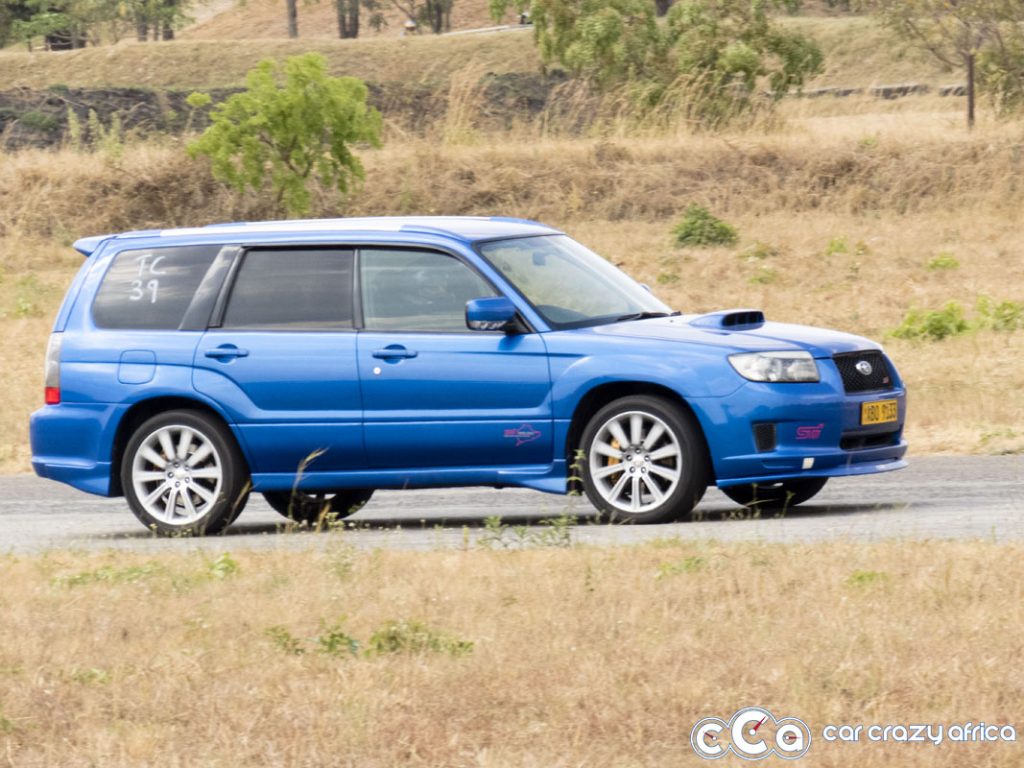
Without getting too much deeper into it, if you know the weight of a car and driver, how quickly it accelerated from 0 to it’s trap speed and how long it took, you can work out how much power it has. For a given weight, getting the vehicle to go from 130kph to 150kph which require an increase in power. There are of course variables like traction, missed shifts etc but these will be fairly small variations. So looking at the TB Class (aka Subaru class), you can compare trap speeds and tell which cars have a few more horses under the hood than when they left factory.
This is all great theory but what happens when we compare some results of some different cars? I’ve picked three cars from the most recent event with some similarities and differences that can be compared with the information above. I’ve included an extra column which is the ET minus 60′ which i’ll discuss below.

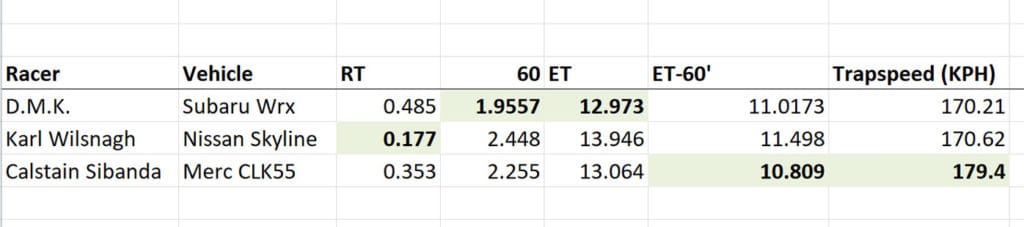
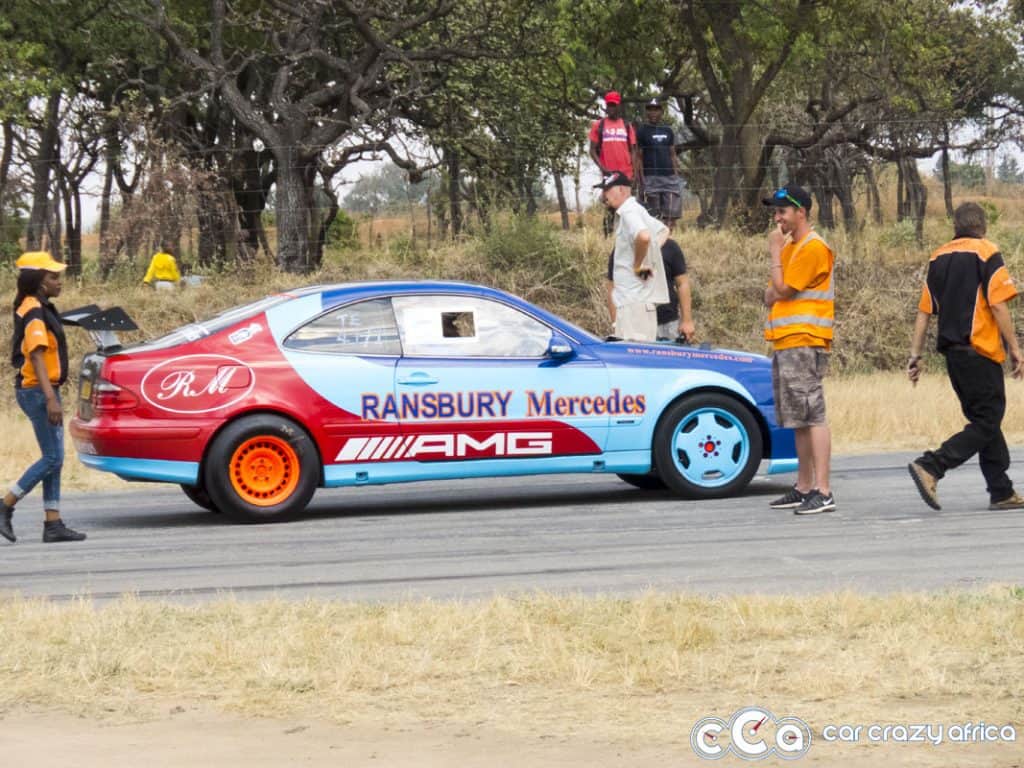
Here we have 3 quite different cars, but with ET’s within 1 second of each other and similar trap speeds. Karl’s Skyline wins the reaction time but being RWD loses out to the WRX’s AWD traction. The difference of their 60′ times is 0.4923 seconds, which when doubled is almost the difference of their ET’s (off by 0.116). Which theoretically means if the skyline can increase its grip and/or remove weight to get a better launch a twelve second pass is possible without adding more power. So what about Calstain’s CLK55? Well it’s no longer the luxury GT it left the factory and now running drag radials to overcome it’s RWD handicap. Even so it still doesn’t match the Subaru’s traction at launch (having a 60′ 0.2993 slower than the subaru), but the 179.4kph hints at its secret weapon…it’s power. Once it does get moving and the tires really bite in, the power lets the CLK gobble up the remaining 383 metres 0.2 faster than the Subaru. Which shows how it makes up for it’s traction deficit with raw power. A little better 60′ launch of 2.1 would see the CLK into the 12’s ahead of the Subaru.
Hopefully this quick introduction to reading a timeslip and drag results helps you appreciate another dimension to drag racing and the different things one can do to improve themselves and their vehicles. Remember race the track, not the streets!